CFD Analysis of Supersonic Airfoil
Overview and Objectives
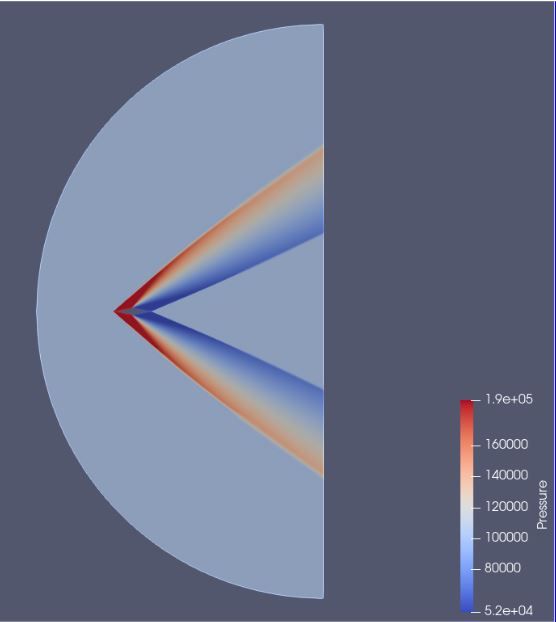
This project concerns supersonic, compressible, turbulent flow past a diamond shaped airfoil, having 4 equal length sides. Using the simplified diamond shape with these conditions, the intention is to characterize and compare the results from the CFD to classic shock-expansion theory. The results of this study are the steady state solution output by the CFD software, which is ANSYS Fluent. The key interest among these findings is to visualize the dependence of aerodynamic forces, lift and drag, on varying angles of attack. The airfoil will analyzed in one degree increments from 0 to 10. Global conditions defined to model the flow are described as below.
- Turbulence: Re = 3,000,000
- k-⍵-SST RANS turbulence model
- Steady state solution: final time step
- Static pressure: P∞=101325 Pa = 1 atm
- Static temperature: T = 300 K
- Supersonic: Mach = 2
- Airfoil dimensions: L = 1 m (chord length), t = 0.2 m (thickness)
Mesh Details
The mesh will be defined with 4 blocks; 1 block at the very inside of the domain, closest to the airfoil, 1 block at the very outside of the domain, farthest from the airfoil at the boundary, and 2 additional blocks to break up the center between the other 2. Variations of mesh refinement, referred to as low, medium, and high resolution meshes, are considered for analysis as follows. Furthermore, the 3 different angles of attack discussed previously are simulated for each refinement level to investigate mesh convergence.
Table 1: Mesh Block Information for Low, Medium, and High Resolution
Table 2: Number of Cells for each Resolution
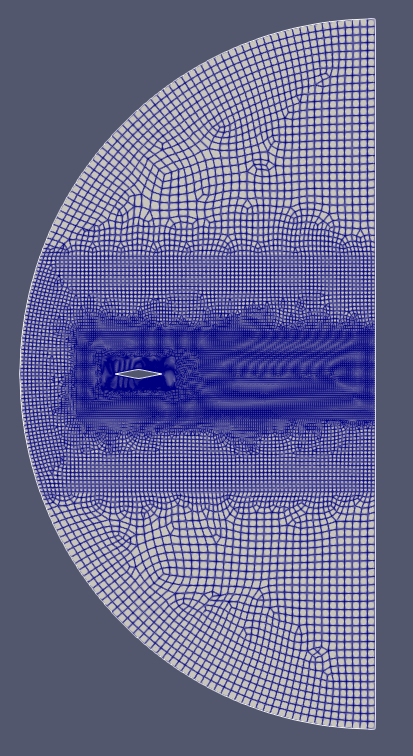
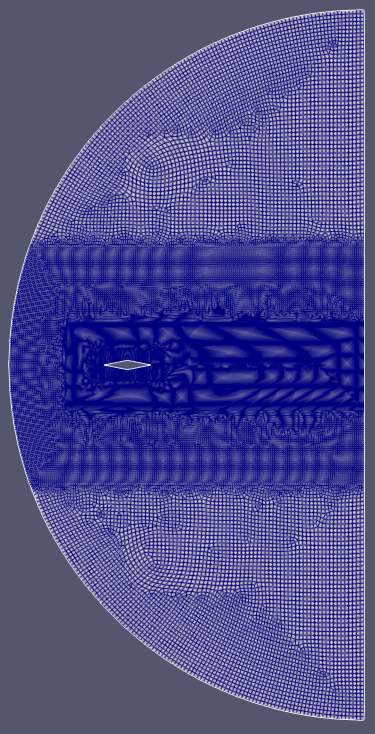
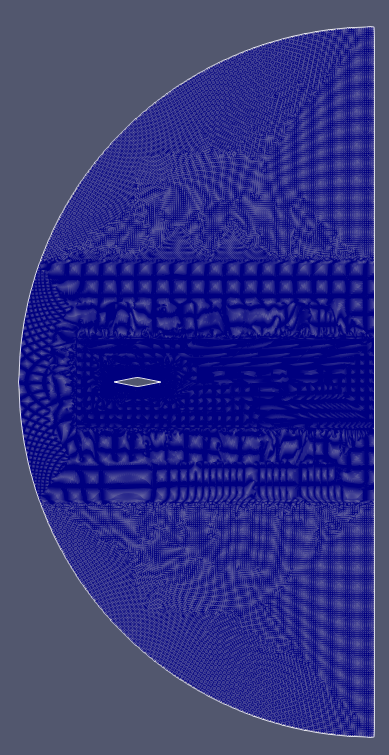
Figures 1-3 depict the different mesh refinements investigated, showing the base case of a 0 degree angle of attack. It should be noted that in this investigation the angle of attack of the incoming air was changed at the inlet and no geometric rotation of the airfoil relative to the flow domain was conducted, which would usually require remeshing of some kind. This increases the turn around time for each seperate simulation, which can save a lot of time. In addition, the uniform lengths of the airfoil should be noted throughout all cases. This provides a visual representation of the block divisions among the semicircle computational boundary.
Analysis: Aerodynamic Forces
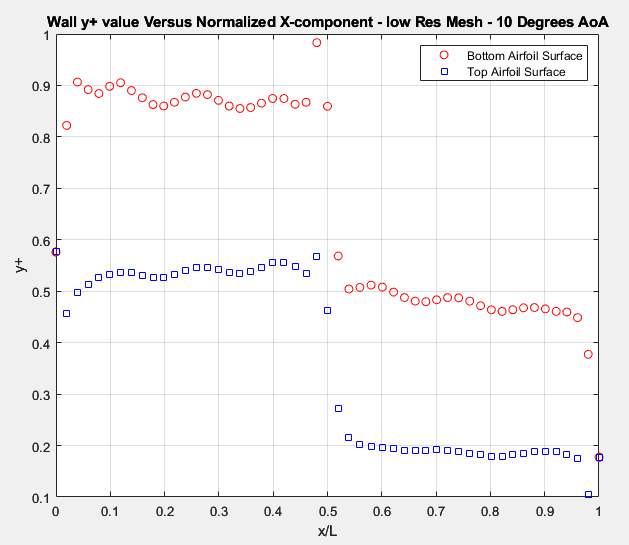
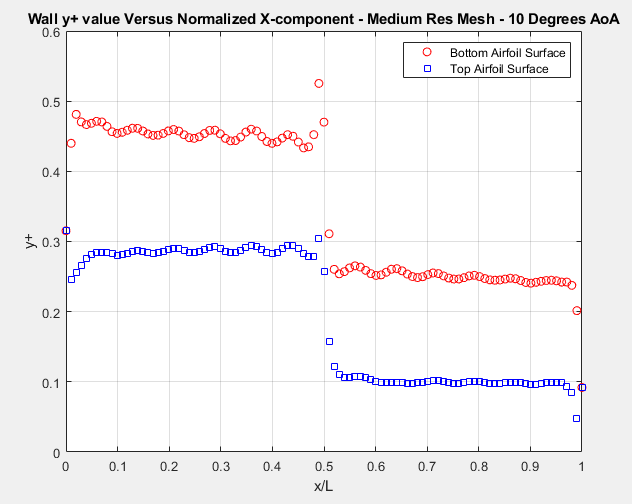
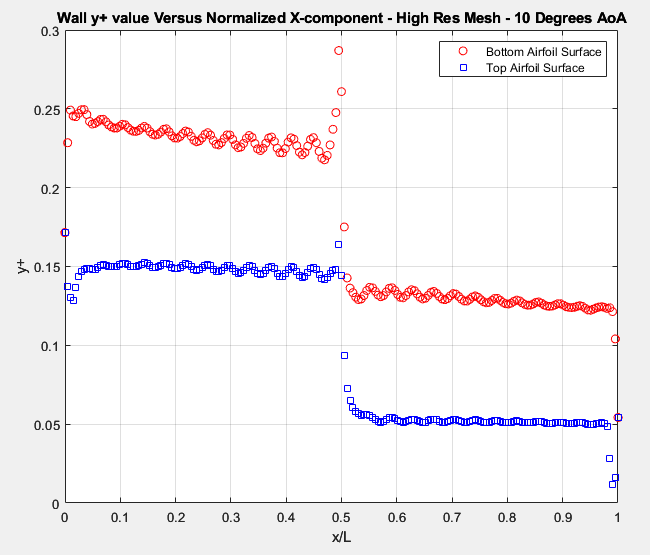
In figures 10-12, we see that as the resolution goes from low to high, the y+ value gets smaller and smaller. For turbulence modeling, y+ on the walls has to be below 1 to get accurate results. The y+ graphs above demonstrate that y+ values are well below 1, so the boundry layer is well resolved by all mesh configurations.
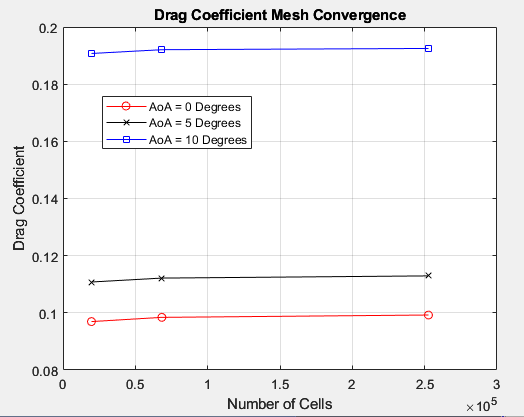
In Figure 13, we see how the drag coefficient converges to 3 different values for the three representative Angles of Attack (0,5,10). For an angle of attack = 0, the drag coefficient converges to about 0.1 as the number of cells increases. For an angle of attack = 5, the drag coefficient converges to about 0.115. Finally, for an angle of attack = 10, the drag coefficient converges to about 0.19
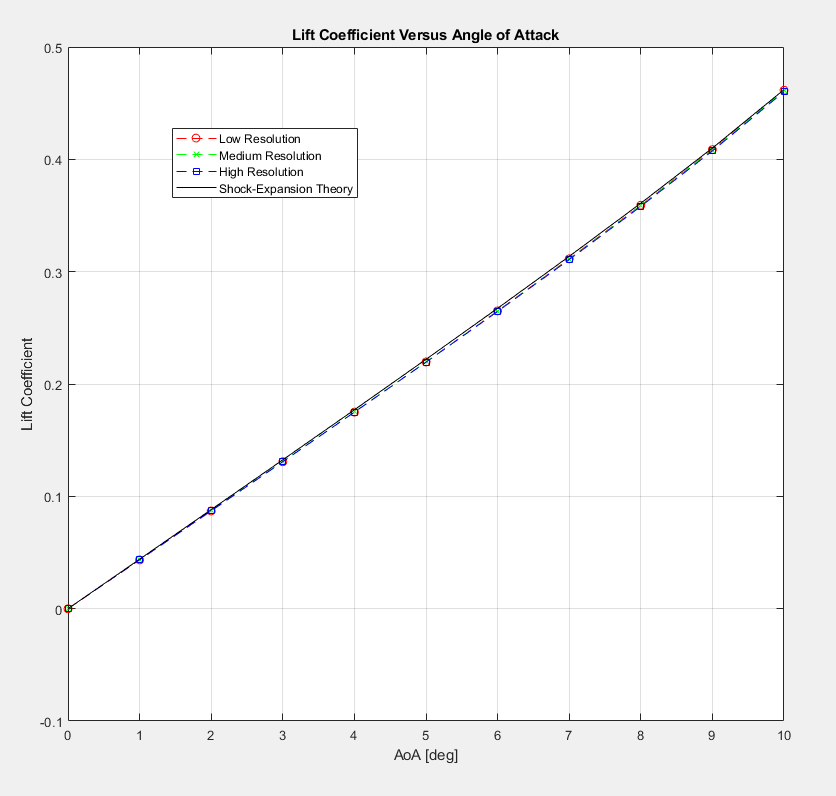
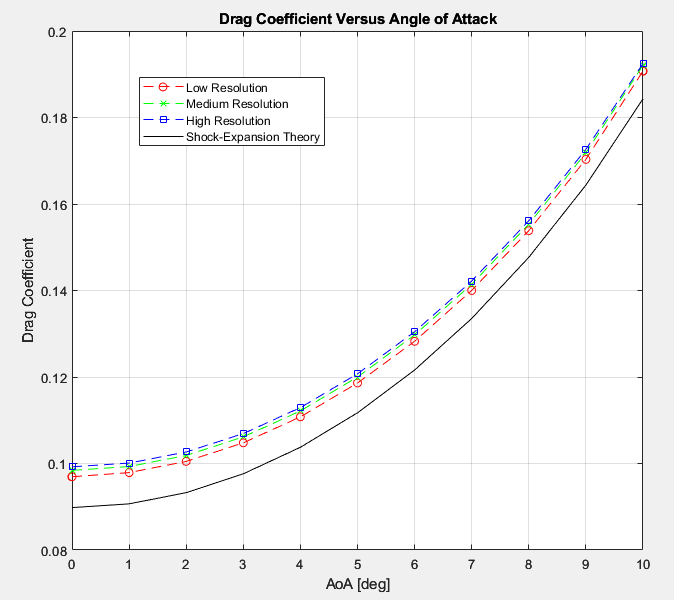
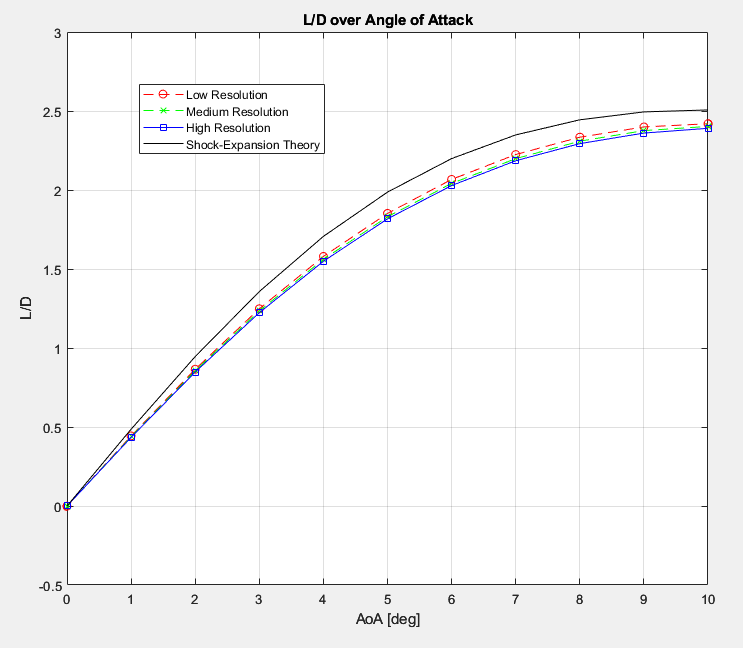
The shock expansion theory is a method used to obtain numerical solutions for lift and drag for supersonic airfoils (Shock-Expansion Theory, 2016). In figure 14-16, we can observe that the values for low, medium, and high resolution seem to follow the same shape as the shock-expansion theory curve. Figure 14 illustrates the tight correlation between the RANS results and theory, which makes sense given that the vast majority of the lift is being generated by pressure forces rather than viscous ones. On the other hand, figure 15 and by extension figure 16 seem to indicate that the predicted drag from shock-expansion theory is mildly below that of RANS predictions. This effect was completely expected since shock-expansion theory only predicts surface pressures on the airfoil surfaces, so the difference between the RANS & theory drag predictions can be assumed to be the viscous component of drag on the airfoil at the varying angles of attack.